 How often are near real-time data updated? For the Maine Tracking Network’s new data dashboard for tickborne diseases, it can be daily. This new display is a convenient, single point of access for daily updates on the number of cases of Lyme disease, anaplasmosis, and babesiosis, as well as weekly updates on the number of suspected tick-related emergency department visits.
Why present these data in near real-time?
Significant increases in these tickborne diseases have led to more frequent requests for the most current data available. To meet this demand, our data team got to work and created a new dashboard to provide current case numbers, and to illuminate peaks of exposure to ticks throughout the year. This online dashboard is a major improvement in the timeliness and convenience of these important data.
What are the display options?
The new dashboard includes case numbers, tables and charts, maps, and a trend chart for tickborne diseases and tick exposures in Maine.
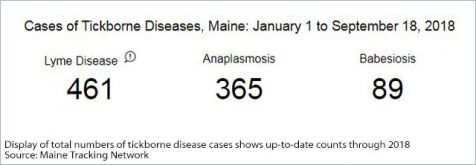
- Case Numbers: Counting from January 1, 2018, quickly find the total number of Lyme disease, anaplasmosis, and babesiosis cases, updated daily.
- Tables and Charts: View county-level breakdowns for a focused look at the case numbers of each disease across the state.
- Maps: Side-by-side maps of the number and rate of cases help visualize which areas of the state have the highest burden of tickborne diseases (number) and which have the highest density of cases by population size (rate).
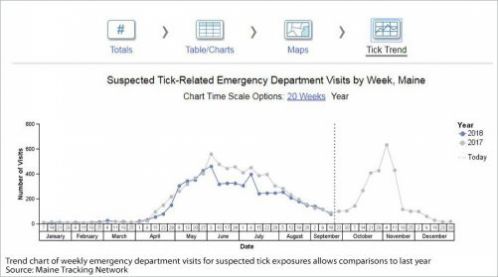
- Tick Trend: Follow weekly counts and seasonal trends of suspected tick-related emergency department visits, and compare visits to last year.
It is important to note that while the near real-time dashboard receives an automatic update every day, case numbers will only change if Maine CDC has identified new cases since the last update.
 What can I do with these data?
Mainers can use this mobile-friendly dashboard to track counts of tickborne disease cases and seasonal peaks in tick exposures to inform decisions about tick prevention. We are especially glad to have this data tool available in advance of the fall months when we typically see a second peak in tickborne disease cases. Users can also see how case numbers change in near real-time over the course of the year, how trends compare to last year, and the level of tick activity right now. Most importantly, these data can be used to raise awareness about the need to practice preventive behaviors year-round, as well as help decision-makers plan prevention efforts.
For a full picture of the issue, the Maine Tracking Network also displays annual data on ticks and tickborne diseases, including customizable town-level maps, trends in disease by age group or location, and annual counts and rates from 2001-2017.
Learn More:
- Explore near real-time data on tickborne diseases in Maine.
- View Maine CDC’s YouTube videos on various tick topics.
- Follow Facebook for posts on tickborne diseases and other Maine Tracking Network topics.